
20220501追記
この記事は,合ってはいるけど非常に冗長な方法を取っています.申し訳ありません.内容を更新し,洗練した内容を別記事に書きました.こちらを参照ください.
・[Python] statsmodelsのLogistic RegressionでOdds Ratioを求める
以下,元記事の内容.
この記事では,pythonのmoduleの一つであるstatsmodelsを用いたLogistic Regressionを行い,かつ,Odds Ratioを計算する方法を紹介する.また,Logistic Regressionまでのデータクリーニングを簡潔に行えるコードの紹介が目的である.
データクリーニングは定型作業なため,繰り返し部分を関数にして与えることによりコードの簡略化を目指すことが出来る.
ここで用いているカスタム関数は,このブログの最後の部分に載せているコードの中に説明があるので,詳細を調べる場合はそちらを参照のこと.
動作はjupyter notebook上を想定している.
コードは,git clone https://github.com/akitoshiblog/blogsiteでlogistic_regressionの下にある.
データの準備
データの準備.最後に載せているカスタム関数に関しては,実行環境の直下に置くか,関数までのパスを追加するかを行うこと.
importするmoduleの一覧は以下の通り.
import pandas as pd
import numpy as np

from collections import Counter
import copy
import statsmodels.api as sm
# custom functions
import myRegression as mR
サンプルデータはstatsmodelsの中に存在するthe American National Election Studies of 1996のデータを用いる.データの詳細に関してはリンクに飛ぶと確認することが出来る.
欠損データが混入したデータセットも使用出来るように,欠損なしのデータに対しても欠損データがあるようにする.
anes96 = sm.datasets.anes96.load_pandas().data
# insert missing values
np.random.seed(130)
rnd1 = np.random.choice(anes96.index,50,replace=False)
rnd2 = np.random.choice(anes96.index,50,replace=False)
anes96.loc[rnd1,"age"] = np.nan
anes96.loc[rnd2,"educ"] = np.nan
データの特徴の確認
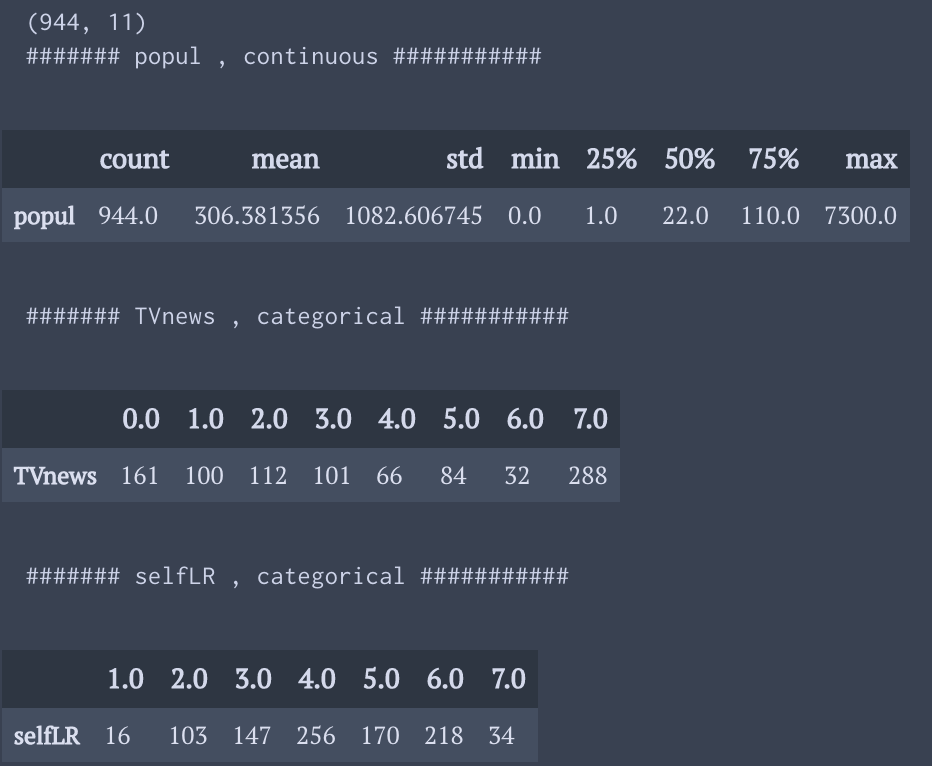
それぞれの変数が連続値かカテゴリカルなデータかを判断して入力する.
連続値ならば基本統計量を算出し,カテゴリカルなデータならばそれぞりの値に該当するデータが何件あるか出力する.
myReg = mR.myRegClass(anes96)
print(myReg.df.shape)
myReg.getValTypes(pri=True)
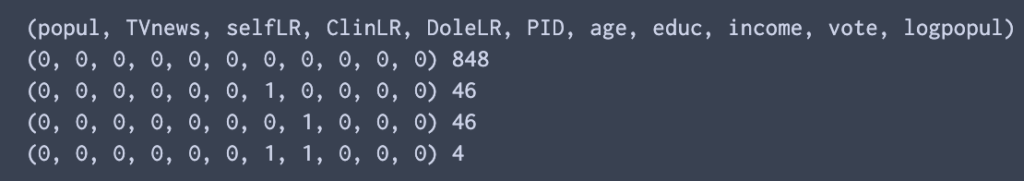
欠損データがどれくらい存在するかを確認する.また,そのパターンも把握出来るようにする.
myReg.checkNan()
“.getValType”のメソッドで準備した”.valTypes”のアトリビューション内に格納されている変数について情報を確認する.ここで,カテゴリー変数については,”val”キーに値が格納される.後にこの”val”キーのarrayを用いて変数をdummy変数用のカテゴリー名に変換する.
display(myReg.valTypes)

データエンジニアニングとLogist regression
the American National Election Studies of 1996のデータエンジニアニングを行う.ここでは,myRegression.pyの中で準備した機能を使うようにした.
myReg = mR.myRegClass(anes96)
myReg.getValTypes(pri=False)

# for continuous variables.
# set the dummy categorical names.
key = "TVnews"
bins = [0,3,6,8]
cateNames = ["seldom","moderate","frequent"]
myReg.cont2Cate(key=key,bins=bins,dummyN=cateNames,nPreKey=3)

# "eq" option specifies which place we insert equal symbol.
key = "income"
bins = [0,8,16,24]
myReg.cont2Cate(key=key,bins=bins,dummyN=cateNames,eq="right")

# include missing values
key = "age"
bins = [19,40,60,80,100]
myReg.cont2Cate(key,bins)

key = "logpopul"
bins = [-2.5,0.09,3.09,4.70,9]
cateNames = ["high_sparse","low_sparse","low_crowded","high_crowded"]
myReg.cont2Cate(key,bins,dummyN=cateNames)

# for categorical variables.
key = "PID"
cateNames = ["Strong Democrat","Weak Democrat","Independent-Democrat"
             ,"Independent-Indpendent", "Independent-Republican"
             ,"Weak Republican", "Strong Republican"]
myReg.getDummyVar(key = key, cateN=cateNames)

# sum up several categories into one.
key = "selfLR"
cateNames = ["Extremely liberal","Liberal","Liberal"
             , "Moderate", "Conservative","Conservative","Extremely Conservative"]
myReg.getDummyVar(key = key, cateN=cateNames,nPreKey=4)

# includes missing values.
key = "educ"
cateNames = ["1-8 grades","Some high school", "High school graduate"
            ,"college", "College degree", "Master's degree", "PhD"]
myReg.getDummyVar(key = key, cateN=cateNames)
最後にデータエンジニアニングが上手く出来ているか確認する.これで,欠損値がなければ問題なし.欠損値がある場合は,その変数の欠損値がダミー変数として取り込まれないことになってしまうので注意すること.
また,”cateNameSum”のアトリビューションの辞書内部には,キーに数値データをダミー変数用の名前に変更した変数名が,値には,ダミー変数のカテゴリーの名前が格納されている.
# check np.nan after replacing the name
myReg.checkNan(myReg.cateNameSum.keys())

display(myReg.df.head().T)
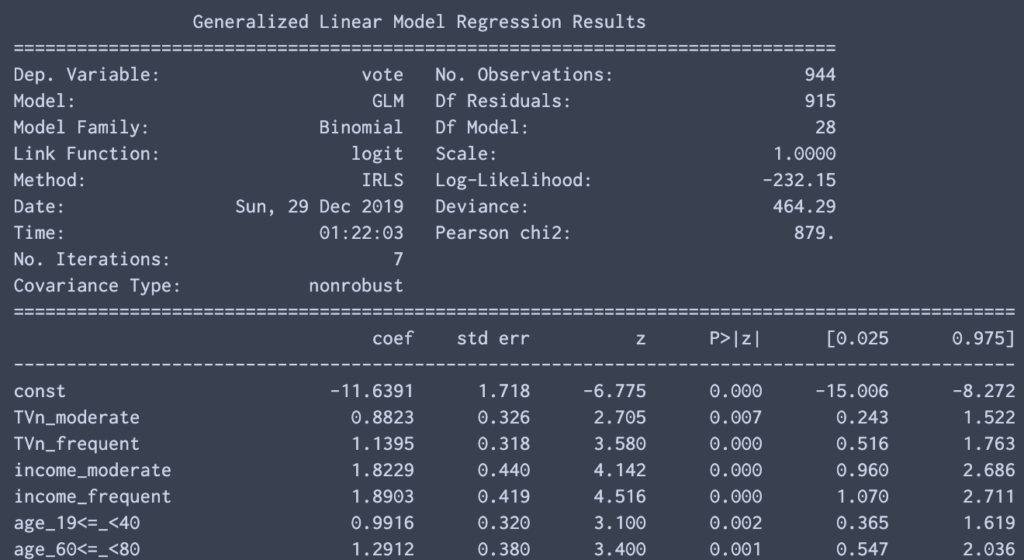
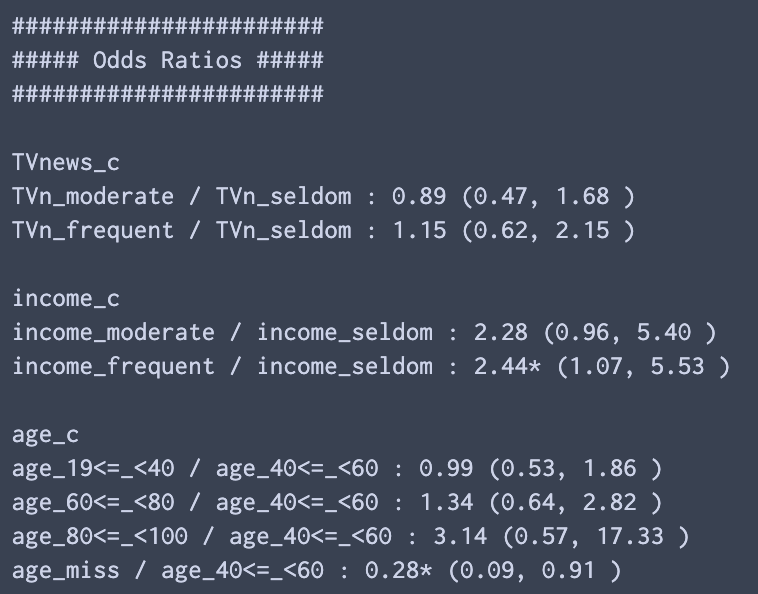
最後に,結果変数の選択とOdds Ratioを計算する際のベースラインを指定する辞書を用意して回すと,statsmodelsの推定結果とOdds Ratioを計算した結果が出力される.ベースラインの変数を指定しないと,説明変数を用意する際に使った一番最初の要素がベースラインとして使われる.
また,定数項はデフォルトで追加されるようになっている.
resVar = "vote"
offsetDic = {"age_c":"age_40<=_<60"}
myReg.logisticOdds(resVar,offsetDic = offsetDic)
コードの補足説明
簡単のため,ロジスティック方程式が以下のように表されるとする.
$$
z = \beta_0 + \beta_1 x_1 + \beta_2 x_2 \
p(X|\beta) = \frac{1}{1 + exp(-z)}
$$
Oddsは以下のように計算される.非常にsimpleな形になるのが特徴.
$$
\frac{ p(X|\beta)}{1 -p(X|\beta)} = exp(z)
$$
ここでx1が男性,x2が女性を表すダミー変数として,X1 = (x1,x2) = (1,0), X2 = (x1,x2) = (0,1) だとする.この時,Odds Ratioは,
$$
Odds Ratio = \frac{ p(X_1|\beta)}{1 -p(X_1|\beta)} /\frac{ p(X_2|\beta)}{1 -p(X_2|\beta)} = exp(\beta_1 - \beta_2)
$$
となる.ここでβ1もβ2も自由パラメータとすると推定が安定しないので,ベースラインに対する回帰係数は1と定めることが多い.
ここで問題になるのは,回帰係数を1にする項をstatsmodelsのLogistic regressionの中にどう取り込むかであるが,それはoffset項として渡せば良い.offset項は線形予測子の中で係数がつかない項を指す.
以下が,"myRegression.py"の"logisticOdds"の一部で,logistic regressionをoffset項ありで行う箇所である.まずコードの上の部分でoffset項として取り扱う変数名と説明変数として取り扱う変数名を分けて保存する.
その後,offset項として取り扱う変数に関しては,一括して足し合わせて一つのpd.Seriesとして引き渡すことで実現可能.
Odds Ratioに関しては推定したパラメーターを利用して上記の式に基づいて計算することが可能である.
        # set offset variables
        cateNameSum= copy.deepcopy(self.cateNameSum)
        for k,v in cateNameSum.items():
            if k in offsetDic.keys():
                offsetVars.append(offsetDic[k])
                v.remove(offsetDic[k])
                expVars += v
            else:
                offsetVars.append(v.pop(0))
                expVars += v

        offset = dfAna[offsetVars].sum(axis=1)

        # logistic regression
        mod = sm.GLM(dfAna[resVar],
                     dfAna[expVars],
                     offset=offset,
                     family=sm.families.Binomial())
        res = mod.fit()
----------雑感(`・∀・´)---------
これでLogistic Regressionのためのデータエンジニアリング,そして推定までのプロセスがシンプルに書けるようになった.
この分析を行うとわかることが,民主党の人よりも共和党の人の方が圧倒的に選挙に行きやすいということ.トランプ政権が誕生したサイレントマジョリティの存在と,民主党が選挙に勝ちにくい理由がこのデータセットからも見て取れるのは面白い!
使用したコード
myRegression.py
#!usr/bin/python
# -*- coding: utf-8 -*-

import pandas as pd
import numpy as np
import matplotlib.pyplot as plt

import copy
from collections import Counter

import statsmodels.api as sm


def getUnique(lis_):
    '''get the unique values and the order of given "lis_" is kept.

    Args:
        lis_ (list) : for getting unique.

    Return:
        list : unique list keeping the order.
    '''
    uni_ = []
    while len(lis_):
        l = lis_.pop(0)
        uni_.append(l)
        while l in lis_:
            lis_.remove(l)
    return(uni_)


class myRegClass():
    def __init__(self,df):
        self.dfOri = df
        self.df = df

        self.cateNameSum = {}
        self.odds = {}


    def checkNan(self,keys=None):
        '''check Nan value patterns.

        Args:
            keys (list) : check the nan pattern for this variables.
                if not given, check the all the kyes in "self.df".
            self.df : dataframe of analysis data.

        Print:
            nan pattern.
        '''
        if keys == None:
            df_ = self.df.copy()
        else:
            keys = list(keys)
            df_ = self.df[keys].copy()
        c = Counter()
        names = [str(s) for s in df_.columns.values]
        names = "(%s)" % ", ".join(names)
        print(names)

        for i in df_.index:
            c[tuple(df_.loc[i,:].isnull().replace({False:0,True:1}) ) ] +=1

        for k,v in c.items():
            print(k,v)

    def getValTypes(self, NCriteria= 20, pri = False):
        '''get types of variables, categorical or continuous.
        types are judged by just number of kinds of data.

        Args:
            NCriteria (int) : more than this value is regarded as continuous.
            pri (bool) : if True, print the types and values of each variable.
            self.df : dataframe of analysis data.

        Sets:
            self.valTypes (dic) : contains type,
                and if data is categorical, possible values are included.
                (data are sorted)
        '''
        df_ = self.df.copy()
        dic = {}

        for k in df_.keys():
            uniq =  df_[k].unique()
            n = len(uniq)
            dic[k] = {}
            if n > NCriteria:
                dic[k]["type"] = "cont"
                if pri:
                    print("####### %s , continuous ###########" %k)
                    display(df_[k].describe().to_frame().T)
            else:
                vals = df_[k].unique()
                vals.sort()
                dic[k]["type"] = "cate"
                dic[k]["val"] = vals

                if pri:
                    print("####### %s , categorical ###########" %k)
                    cnts = df_[k].value_counts(dropna=False)
                    display(cnts[vals].to_frame().T)
        # Sets
        self.valTypes = dic

    def cont2Cate(self,key,bins,eq = "left",keyC=None,dummyN=None,nPreKey=10):
        '''continuous variables are converted into categorical variables.
        dataframe are added with dummy variables for each categorical variable.

        Args:
            key (str) : target variable.
            bins (list) : list of borderlines.
            eq (str) : "right" or "left" , decide "equal" is included right or left.
            keyC (str) : new categorical name. if not given, key + "_c" is applied.
            dummyN (list) : new categorical names for dummy variables.
            nPreKey (int) : number of characters from target variable for
                prefixes of dummy variables.
            self.df : dataframe of analysis data, which are edited after this func.

        Sets:
            self.df : new categorical and dummy variables are added to columns.
            self.cateNameSum (dic) : one category name and multiple names for
                dummy variables are given.

        '''
        nBins = len(bins)
        if keyC == None:
            keyC = "%s_c" %key

        df_ = self.df

        conds = []
        cateN = []

        for i in range(nBins - 1):
            if eq == "left":
                cond = (bins[i] <= df_[key]  ) & ( df_[key] < bins[i+1])
                name = "%s_%s<=_<%s" % (key[:nPreKey],str(bins[i]),str(bins[i+1]))

            elif eq == "right":
                cond = (bins[i] < df_[key]  ) & ( df_[key] <= bins[i+1])
                name = "%s_%s<_<=%s" % (key[:nPreKey],str(bins[i]),str(bins[i+1]))

            else:
                raise Exception("'eq' takes 'left' or 'right'")


            conds.append(cond)
            cateN.append(name)

        if type(dummyN) != type(None):
            cateN = [ "%s_%s" % (key[:nPreKey], s) for s in dummyN]

        # add missing category name
        condNon = df_[key].isnull()
        if condNon.sum() > 0:
            name = "%s_miss" % (key[:nPreKey])
            conds.append(condNon)
            cateN.append(name)


        for cond, name in zip(conds, cateN):
             df_.loc[cond,keyC] = name
        dfDummy = pd.get_dummies(df_[keyC])
        df_ = pd.concat((df_,dfDummy),axis = 1 )

        # Sets
        self.df = df_
        self.cateNameSum[keyC] = getUnique(cateN)

    def getDummyVar(self,key,cateN, repV=None,keyC=None, nPreKey =10):
        '''categorical variables are converted into dummy variables.
        dataframe are added with dummy variables for each categorical variable.

        Args:
            key (str) : target variable.
            cateN (list) : list of categorical names for each value
                within the target variable..
            repV (list) : list of replaced value for each "cateN".
                same index of "cateN" and "repV" are replaced.
                if not given, values of "valTypes" are used.
            keyC (str) : new categorical name. if not given, key + "_c" is applied.
            nPreKey (int) : number of characters from target variable for
                prefixes of dummy variables.
            self.df : dataframe of analysis data, which are edited after this func.
            self.valTypes (dic) : types (and values) of each variable are contained.

        Sets:
            self.df : new categorical and dummy variables are added to columns.
            self.cateNameSum (dic) : one category name and multiple names for
                dummy variables are given.

        '''
        if keyC == None:
            keyC = "%s_c" %key
        if repV == None:
            repV = self.valTypes[key]["val"]

        df_ = self.df

        newCateN = []
        repDic = {}
        for k,v in zip(repV, cateN):
            name = "%s_%s" % ( key[:nPreKey], v)
            newCateN.append(name)
            repDic[k] = name

        # add missing category name
        condNon = df_[key].isnull()
        if condNon.sum() > 0:
            name = "%s_miss" % (key[:nPreKey])
            newCateN.append(name)
            repDic[np.nan] = name

        df_[keyC] = df_[key].replace(repDic)
        dfDummy = pd.get_dummies(df_[keyC])
        df_ = pd.concat((df_,dfDummy),axis = 1 )

        # Sets
        self.df = df_
        self.cateNameSum[keyC] = getUnique(newCateN)

    def logisticOdds(self,resVar,offsetDic = {},const=True,pri=True):
        '''logistic regression for calculating odds ratio is done.

        Args:
            resVar (str): result variable. Takes only 0 or 1.
            offsetDic (dic) : determines which variable is used for baseline.
                if not, the first category of dummy varibales is used for baseline.
            const (bool): add const term or not.
            pri (bool) : print result or not.
            self.df : dataframe which is already added with dummy variables.
            self.cateNameSum (dic): category and dummy variables for that category.

        Sets:
            self.res : result of logistic regression
            self.expVars : explanatory variables that are used in the analysis
            self.offsetVars : explanatory variables that are used for offsets.
            self.odds : result of odds ratios is contained here.
        '''
        dfAna = self.df.copy()
        expVars = []
        offsetVars = []

        if const:
            dfAna["const"] = 1
            expVars.append("const")

        # set offset variables
        cateNameSum= copy.deepcopy(self.cateNameSum)
        for k,v in cateNameSum.items():
            if k in offsetDic.keys():
                offsetVars.append(offsetDic[k])
                v.remove(offsetDic[k])
                expVars += v
            else:
                offsetVars.append(v.pop(0))
                expVars += v

        offset = dfAna[offsetVars].sum(axis=1)

        # logistic regression
        mod = sm.GLM(dfAna[resVar],
                     dfAna[expVars],
                     offset=offset,
                     family=sm.families.Binomial())
        res = mod.fit()

        # Sets
        self.res = res
        self.expVars = expVars
        self.offsetVars = offsetVars

        if pri:
            print(res.summary())
            print("n#######################")
            print("##### Odds Ratios #####")
            print("#######################")

        for k in self.cateNameSum:
            self.calcOdds(k,pri=pri)


    def calcOdds(self,key,pri=True):
        '''calculate odds ratio using the output of logistic regression ("res")

        Args:
            key (str): target variable.
            pri (bool): print results of not.
        '''
        self.odds[key] = {}

        res = self.res
        cateNSum = copy.deepcopy(self.cateNameSum)
        cateNames = cateNSum[key]

        for v in self.offsetVars:
            if v in cateNames:
                cateNames.remove(v)
                base = v
                break
        print("n%s" % key)
        for name in cateNames:
            OR = np.exp(res.params[name] - 1)
            cL = np.exp(res.conf_int().loc[ name,0] -1 )
            cH = np.exp(res.conf_int().loc[ name,1] - 1)
            compName = "%s / %s" % (name, base)
            self.odds[key][compName] = {}

            self.odds[key][compName]["OR"] = OR
            self.odds[key][compName]["OR_l"] = cL
            self.odds[key][compName]["OR_h"] = cH
            if pri:
                sig = ""
                if cL > 1.0 or cH < 1.0:
                    sig = "*"
                print("%s : %2.2f%s (%2.2f, %2.2f )" %(compName, OR,sig,cL,cH) )

コメント
[…] 以下は関係する記事.・非線形最適化関数scipy.minimizeの各手法の実装例 ・[python] Logistic Regressionを用いてOdds Ratioを求める […]